
Circular economy ideas can sound abstract, but in an operation they reduce to a material balance: how much goes in, how much becomes product, and where the rest ends up. Measuring that balance shows where prevention, reuse, and recycling would help most.
This guide covers the waste hierarchy, the main measures (yield, waste generated, diversion, and value lost), and a worked weekly balance in which prevention raises yield from 82% to 87%. It also explains why a rising diversion rate can be misleading, and why prevention comes before recycling. Figures are illustrative.
Before You Start
Why Look at Material Flow
Materials Are Most of the Cost
For many products, purchased material is the largest cost. Every kilogram that ends up as scrap was bought and processed.
Yield and Waste Are Two Sides
Raising material yield reduces waste at the source, which is worth more than better handling of the waste.
Disposal Choices Matter
Reuse, recycling, and landfill have different costs and impacts. Tracking where waste goes shows how much is diverted.
It Connects to Circular Thinking
Circular economy ideas, such as designing out waste and keeping materials in use, start with knowing how materials move.
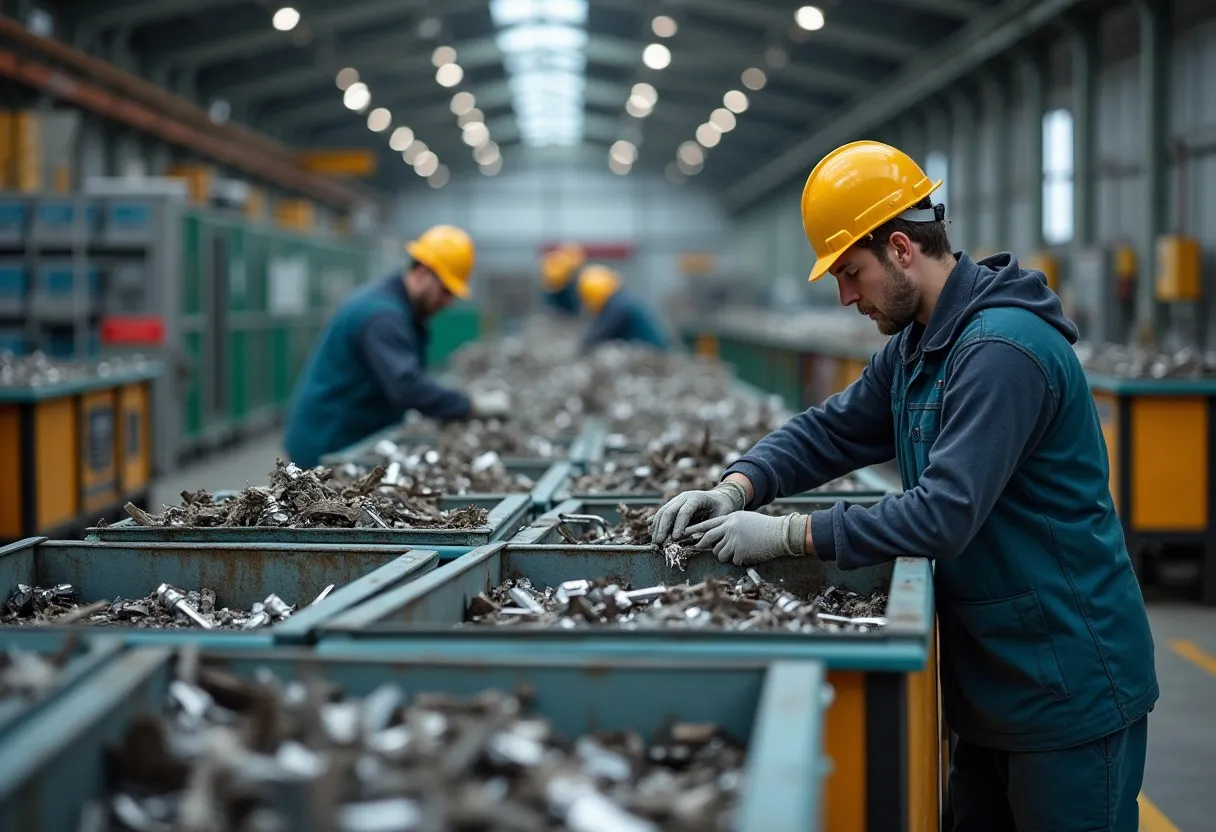
The Waste Hierarchy and Circular Thinking
The waste hierarchy ranks options from most to least preferred. Exact wording varies by jurisdiction, but the order is broadly:
| Level | Meaning | Example |
|---|---|---|
| Prevent (source reduction) | Do not create the waste in the first place | Redesign the part or nesting to leave less offcut |
| Reuse | Use the item or material again for the same or a similar purpose | Returnable containers; offcuts used for smaller parts |
| Recycle | Reprocess material into new material | Selling metal scrap for remelting |
| Recover | Recover energy or other value where recycling is not possible | Energy recovery from residual waste |
| Dispose | Landfill or incineration without recovery | Contaminated residues |
Circular economy thinking, as described by the Ellen MacArthur Foundation and others, aims to design out waste and pollution, keep products and materials in use, and regenerate natural systems. For an operation, that translates into practical steps such as prevent first, choose materials that can be reused or recycled, and track where every kilogram goes.
Measures for Material Flow
| Measure | Definition |
|---|---|
| Material yield | Product output divided by material input |
| Waste generated | Input minus product output (in mass terms) |
| Diversion rate | Waste reused or recycled divided by waste generated |
| Landfill rate | Waste sent to landfill divided by waste generated, or per unit of product |
| Value of material lost | Waste mass times the purchase cost of the material |
Worked Example: A Weekly Material Balance
A plant tracks 1,000 kilograms of material input in a typical week. Of this, 820 kg becomes product and 180 kg is waste: 20 kg reused internally, 90 kg recycled, and 70 kg landfilled. The material costs $2.40 per kilogram and landfill costs $0.12 per kilogram. The figures are illustrative.
| Measure | Baseline | After changes |
|---|---|---|
| Product | 820 kg | 870 kg |
| Waste generated | 180 kg | 130 kg |
| Reused / recycled / landfilled | 20 / 90 / 70 kg | 20 / 80 / 30 kg |
| Material yield | 82% | 87% |
| Diversion rate | 61.1% | 76.9% |
| Value of material lost plus landfill | $440.40 | $315.60 |
What changed. The plant re-nests parts and buys bar stock in lengths that fit better, which prevents 50 kg of waste a week. Yield rises from 82% to 87%, and landfilled waste falls to 30 kg. The weekly value of material lost plus landfill cost falls by $124.80, about $6,240 over a 50-week year.
A subtle point. The diversion rate rises from 61.1% to 76.9%, but most of that gain comes from less landfilled waste, not from recycling more. The recycled quantity actually falls from 90 kg to 80 kg because there is less scrap to recycle. That is the right outcome: prevention beats recycling. Reporting only the diversion rate could hide it, so report waste generated and yield too.
Try your own numbers in the Waste Diversion and Material Yield Calculator.
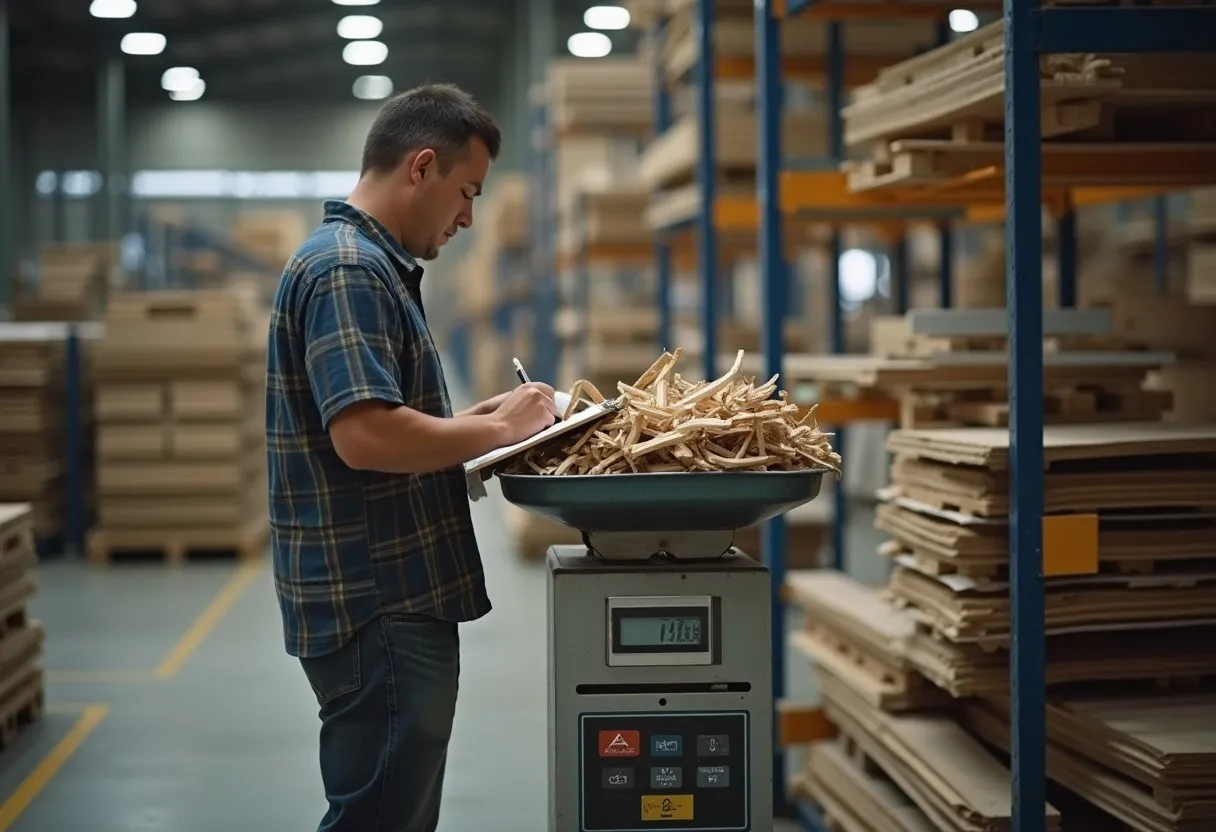
Keeping Materials in Use: Design and Supplier Choices
Much of a product's waste is determined before it is made, by the choice of materials, the design, and the supply chain. Circular strategies can be ranked, like the waste hierarchy, from keeping things in use in their current form to recovering their material.
Design choices. Fewer and simpler materials, standard fasteners, parts that can be separated, and durable designs make reuse and recycling practical. Mixed materials that cannot be separated are often lost.
Supplier choices. Specify packaging that can be returned or recycled, ask for recycled content where quality allows, and work with suppliers on take-back. Shared containers and standard pallets can cut cost and waste together.
Process choices. Nesting, cutting to size, improved yield, and keeping production scrap clean and separated maintain its value. Contamination can turn a valuable stream into waste.
Look for secondary users. One process's offcut may be another's input. Finding a buyer for clean scrap or a use for an offcut keeps it in use and can produce revenue.
Closing the Loop: Customers, Data, and Honest Claims
Keeping material in use requires cooperation beyond the plant and reliable information on what is happening to it.
- Track material by stream and destination, including weights and contamination rates, and confirm where it actually goes. Material sent for recycling that ends in landfill does not count as recycled.
- Know the rules. Waste classification, storage, transport, and recycling may be regulated. Check the requirements with qualified professionals and keep records.
- Engage customers. Take-back schemes, returnable packaging, and repair services work when customers can use them easily.
- Measure more than diversion. Track waste generated per unit, material yield, recycled content, and the share of packaging that is reusable or recyclable.
- Count the full cost and value, including avoided purchases, disposal savings, and revenue from sales of scrap, and any extra handling or transport.
Beware of downcycling and claims. Recycling that turns a material into a lower-value use, or that needs more energy than virgin production, may not be the best choice. Environmental claims to customers must be accurate and supported by evidence. Vague or overstated claims create legal and reputational risk, and you should check the rules for your markets.
Start small. Choose one stream, such as clean metal offcuts or packaging, map where it goes, and find one improvement. Measure the result and build from there. See the Waste Diversion and Material Yield Calculator, the Supplier Quality guidance in the Body of Knowledge, and the Lean and Green Waste Reduction Guide. This guide is educational and is not environmental, legal, or engineering advice. Follow the laws, permits, and standards that apply to you. Figures in the examples are illustrative.
Self-Assessment Questions
- Do we know how much material goes in, and where each kilogram ends up?
- Do we work first on prevention, before reuse and recycling?
- Do we report waste generated and yield, and not only the diversion rate?
- Do we know the true cost of waste: purchase cost plus handling and disposal?
- Do we check that recycled or reused material really is used, and not stockpiled?
Common Mistakes
Celebrating Diversion Alone
A high diversion rate can accompany high waste. Prevention is the goal.
Counting Waste Without Cost
Without value, streams cannot be ranked or funded. Include purchase and disposal costs.
Ignoring the Rest of the Chain
Moving waste to a supplier or customer is not reduction. Consider the whole flow.
No Baseline
Without a baseline balance, improvement cannot be shown.
Circular Economy and Material Flow: Frequently Asked Questions
What is the waste hierarchy?
The waste hierarchy ranks waste management options from most to least preferred: prevent waste in the first place, reuse, recycle, recover energy or value, and dispose. Exact wording differs between jurisdictions, but the principle is that preventing waste is better than managing it after it is created.
What is a diversion rate, and why can it mislead?
The diversion rate is the share of waste that is reused or recycled instead of landfilled. It can mislead because it can be high while total waste is also high, and because preventing waste can lower the recycled quantity even though the outcome is better. Report waste generated and material yield alongside it.
How does the circular economy apply to a factory?
In practice it means preventing waste through design and process changes, choosing materials and packaging that can be reused or recycled, and tracking where every kilogram goes. A material balance of input, product, and each waste destination is the starting point.
Sources and Further Reading
- Ellen MacArthur Foundation, materials on the circular economy.
- US Environmental Protection Agency, Waste Management Hierarchy and Sustainable Materials Management materials.
- European Union Waste Framework Directive, for the waste hierarchy as applied in the EU (check the current text).
- ISO 14051, Environmental management: material flow cost accounting.